Power Query & Salesforce Reports: 2000 row limit

SFXLIn 2014, Microsoft added a Salesforce Reports connector to Power Query making it easy to pull data straight into Excel.  Awesome! Unfortunately, Salesforce limits results to 2000 rows.  That’s not Microsoft’s fault.  That limit was set by Salesforce back in the Middle Ages when resources were scarce.  Or something.  I can’t explain it. It sure does cause a lot of contortions to work around.

Here are three workarounds I’ve used to exceed that 2k limit:

VBA CONTROLLING IE:  Manually exporting a report in the browser is not limited.  So I wrote a VBA macro to fire up IE, log into Salesforce, run a report, click the Export button, download to Excel. Ugh. It works. It’s fragile. It’s a lot of code.

APPEND method: This one’s MUCH easier. Create multiple copies of your report in Salesforce.com, each limited to a different “slice” of the data.  Hopefully, each will be <2000 rows and when combined you’ll have a full dataset. In Power Query, connect to each report, setting all but one (the primary) to “Load To…Only Create Connection“.  Then in the primary query Combine…Append the others and load to the worksheet.  But if any of these queries exceeds 2000 rows, you’ll be missing data and there’s no error message to warn you.

PARAMETER method:  You can run a Salesforce Report in a browser with parameters in the URL. By limiting the report to a small set of data you have a better chance of staying below 2k.  Javier Gonzalez does a good job of explaining this in a blog post here.  Basically, you put filters on your report in Salesforce report ahead of time.  The operator and the value are easy to modify with parameters later.  But the field name is not. In fact, placeholders that allow all data to pass the saved filters might be a good idea.

Example of saved report with filters. Notice that most data is likely to pass through these filters. The unique report ID is used in the URL.
Example URL: https://salesforce.com/00Oa00000XXXXX

ReportBefore

Parameters added to the URL modify the filters on the fly.
https://salesforce.com/00Oa00000XXXXX?pn0=gt&pv0=999&pn1=eq&pv1=New%20York&pn2=eq&pv2=NY
ReportAfter
Careful: parameter numbers start with zero

The updated filters are temporary.  But if the user decides to click the Save button after the results appear these parameters become permanent.  Yikes! You’d need to specify complete parameters every time to avoid unexpected results left over from a previous run.  Hmmm… I’m not loving that.  WAIT!  I have an idea.  Combine Power Query and parameters with a little VBA.

VBA PARAMETER SAVE method:  In Excel, I can select parameters for the report, a formula generates the URL with those parameters all combined and correct. It’s too easy to mess these up unless its automated.  A button click runs VBA that opens IE, navigates to the URL. When “not IE.Busy”, VBA executes the IE Save button, closes the browser, then updates Power Query.  Voila!  It actually does work.
The report is now saved with my current parameter set, but that’s a good thing. I’ll only use it with this Excel Power Query.  Each time, parameters are provided on the fly, the report is saved and Power Query will simply return the newly filtered results.  Still limited to 2000 rows. But at least I can filter the report easily to limit results as needed.

Meanwhile, we need a more robust solution.

What SALESFORCE.COM can do: Limiting report exports to 2000 rows is painful and outdated.  Given that Salesforce Reports do not allow SELECT DISTINCT (yep!) this is a huge point of frustration.  Sure I can remove duplicates in Excel easily, but I’m wasting some of my precious 2k allotment on dupes.  I can manually export the full report in the browser, but who wants to do anything manually any more.
Vote to increase the 2000 row limit here.
Vote to add DISTINCT rows here while you’re at it.

What MICROSOFT can do: Power Query doesn’t have any way to pass parameters to Salesforce Reports – yet. I’m hoping they will add that capability in the future.  I posted a request for that feature here.  Go vote for it now to increase the chances.


twittermail

The Bacon Bowl: Excel Antipattern #1

Wikipedia: An anti-pattern is a common response to a recurring problem that is usually ineffective and risks being highly counterproductive

The Bacon Bowl - As Seen On TV!This little doo-hickey appeals to our inner child.  It delights us with its audacious premise.  It makes a BOWL! Out of BACON! Whaaaat? Gotta get one and see if that works.

If you haven’t seen the Bacon Bowl advertised, its a rubber thing you wrap with bacon and microwave.  Skip forward to 10:20 minutes into this video to see what the excitement is all about.

Let’s be honest.  Is there any reason to serve food in a bowl made of bacon?  Cool trick. Fun to try. Bacon is always delicious.

But you don’t need it.

“OMG is that SmartArt on the splash screen?” Yeah. Amazing, right?

Excel is so versatile it can literally do almost anything.  It’s easy to construct your own astonishing yet pointless “bacon bowl maker.”  Just take a feature that usually serves one purpose and use it in a completely unexpected way with another feature — then show your co-workers.

It’s a bar chart with only one bar that simulates a progress bar. Just have your VBA macro increment a cell as a data source as it plods along. (Yeah, I did that. Guilty.)  Or a splash screen that pops up when loading the workbook to let the user know that they just opened the workbook they just opened.  Do they need it? No. Is it cool. Mighty cool.  (If you find yourself yearning to try this, at least don’t make users click to dismiss it. OzGrid shows you how to make a form kill itself after 5 seconds.)

Knitting bloggers are prone to bacon-bowling: A sock with toes!  Hats with pockets! Sweaters with attached mittens that button onto the sleeve! Both knitters and Excel pros have creativity, enthusiasm and unlimited possibilities.  The difference is knitters don’t inflict their creations on their co-workers.  Just friends & family.  But we Excel professionals should be building spreadsheets to get things done efficiently.  We don’t need to show off with tricks when we can dazzle with real productivity and insight.

Knitted LederhosenIf you want to knit these fabulous 1975 era knitted lederhosen – let your freak flag fly.  Or maybe you want to use the current date to apply seasonal color to spice up the order tracker for Janice in Accounting?  Resist the urge.  You know why.  Admittedly, I have dreamed of doing this. It would be fun.  Especially at Halloween. But I can’t justify it.  This was designed for teaching schoolkids to learn Excel. Just for fun.

The difference between a frivolous gadget and an elegant solution can be subjective.  So although I could point out a few Excel “bacon bowls” out there on the blogs, to avoid hurt feelings (folks are proud of their inventions) I’ll let you be the judge.

Meanwhile, I take it day by day. I’m still in bacon bowl recovery, learning to strip things down to the essentials and keep the overall design simple.  And then someone tweets a link to a blog post describing a slider linked to an array formula with a sound file that plays when no results are found in the filtered data and….agggghhh!  I have to turn my head and go read a chapter of Edward Tufte’s “The Visual Display of Quantitative Information until the urge passes.

Bottom line: if a feature doesn’t solve a real problem, it’s probably not needed.  Even if it *IS* cool.  Your users will appreciate simplicity of design.

twittermail

Microsoft Data Insights Summit: Trip Report

I finally returned home last night after a two week “walkabout” from Wisconsin to Seattle and back.  Visiting family along the way, camping on Puget Sound and in the mountains of Wyoming & Montana.  The excuse for the trip was the Microsoft Data Insights Summit in Bellevue on March 22-23.

2016-03-28_0937

This was the first year for this conference.  Excel is back into the spotlight as a serious player in the enterprise — a platform for data analysis, integration, presentation. The focus was PowerBI…and Excel.  But mostly PowerBI.  And most of the presenters were Microsoft employees.

The keynote was a whirlwind of new features.  PowerBI.com is constantly evolving.  I’m not sure whether its a smarter move to dive in now or wait for things to settle down.  Some of the whizbang stuff is cool, but we’ve got a lot of unsexy plumbing to rig up before we can implement the razzle dazzle of Sand Dance and Apple Watch dashboards.  Most Excel users, SQL DBAs and software developers won’t realize how big this change is going to be until Office 365 and PowerBI are more widely adopted.

If you haven’t seen PowerBI tools in Excel, Leif Brenne (Excel Sr. Program Mgr at Microsoft) does an intro for Excel users.

Rob Collie not only knows the tech, but he understands the reality of implementation and had a lot to say about why enterprise should embrace what he calls “Modern Excel”.  Beyond just technical walk throughs, we need more of this kind of wisdom born of experience.

Alberto Ferrari‘s DAX sessions were so popular he had to add more to the schedule.  DAX is the language of Power Pivot & SQL Server Analysis Services.  You don’t need to learn DAX to use Power Pivot to “join” tables and build a simple data model in Excel, but if you want to understand what’s happening behind the scenes and implement some customized tricks you’ll want to learn DAX. Two sessions on video here:  DAX 101 and Advanced DAX.

Tuesday I participated in a focus group with Microsoft. We signed non-disclosure agreements, got a free pen and sat down to have our brains picked by some sharp & friendly MS folks.  But, honestly, it was like a group therapy session.  I learned a lot from the other attendees at the table. Everyone had different challenges but a lot in common too.  Fascinating and stimulating to hear their ideas and workarounds. Customers like Johnson Controls, Archer Daniels Midland, Metro Bank & the Republican National Committee share their stories, videos here.

At the hotel lounge, I met a software developer who was building a product to automatically refresh Power Query using MS Task Scheduler. Which interested me because I’d just tackled the problem a different way (VM + batch file + VBA).  Any minute now Microsoft may add a “schedule refresh” feature to Power Query and make all our DIY solutions obsolete.  That’s how fast things are changing lately. (PowerBI.com has automatic refresh and it’s working great for me on a nightly basis.)

More later…I have a pile up of work to catch up on.

twittermail

Field-dev’d Excel tool literally saved lives in Afghanistan

In a recent blog post, “An Infantryman Learns to Code“, Canadian coder Antoine Grondin describes learning to code using Excel VBA in Kandahar, Afghanistan.  His story is typical of many people who have turned to Excel for solving immediate challenges.  What isn’t typical is that his solution actually saved lives by reducing the time it took to respond to requests for MEDEVAC from 5 minutes to 15 seconds.  (Also unusual, he was rewarded and praised for his accomplishment.)

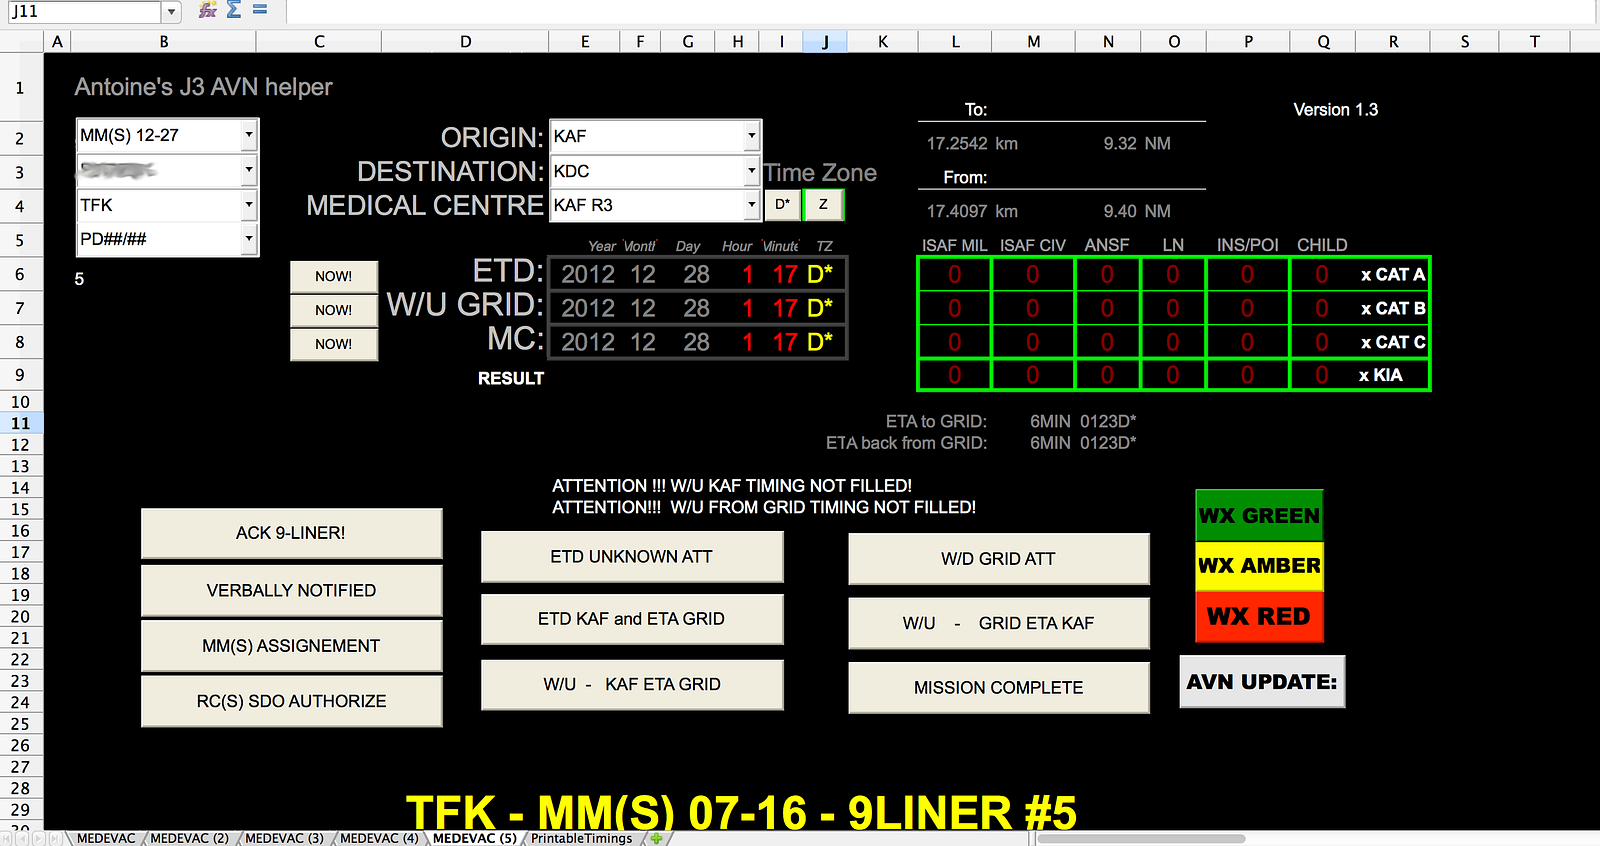
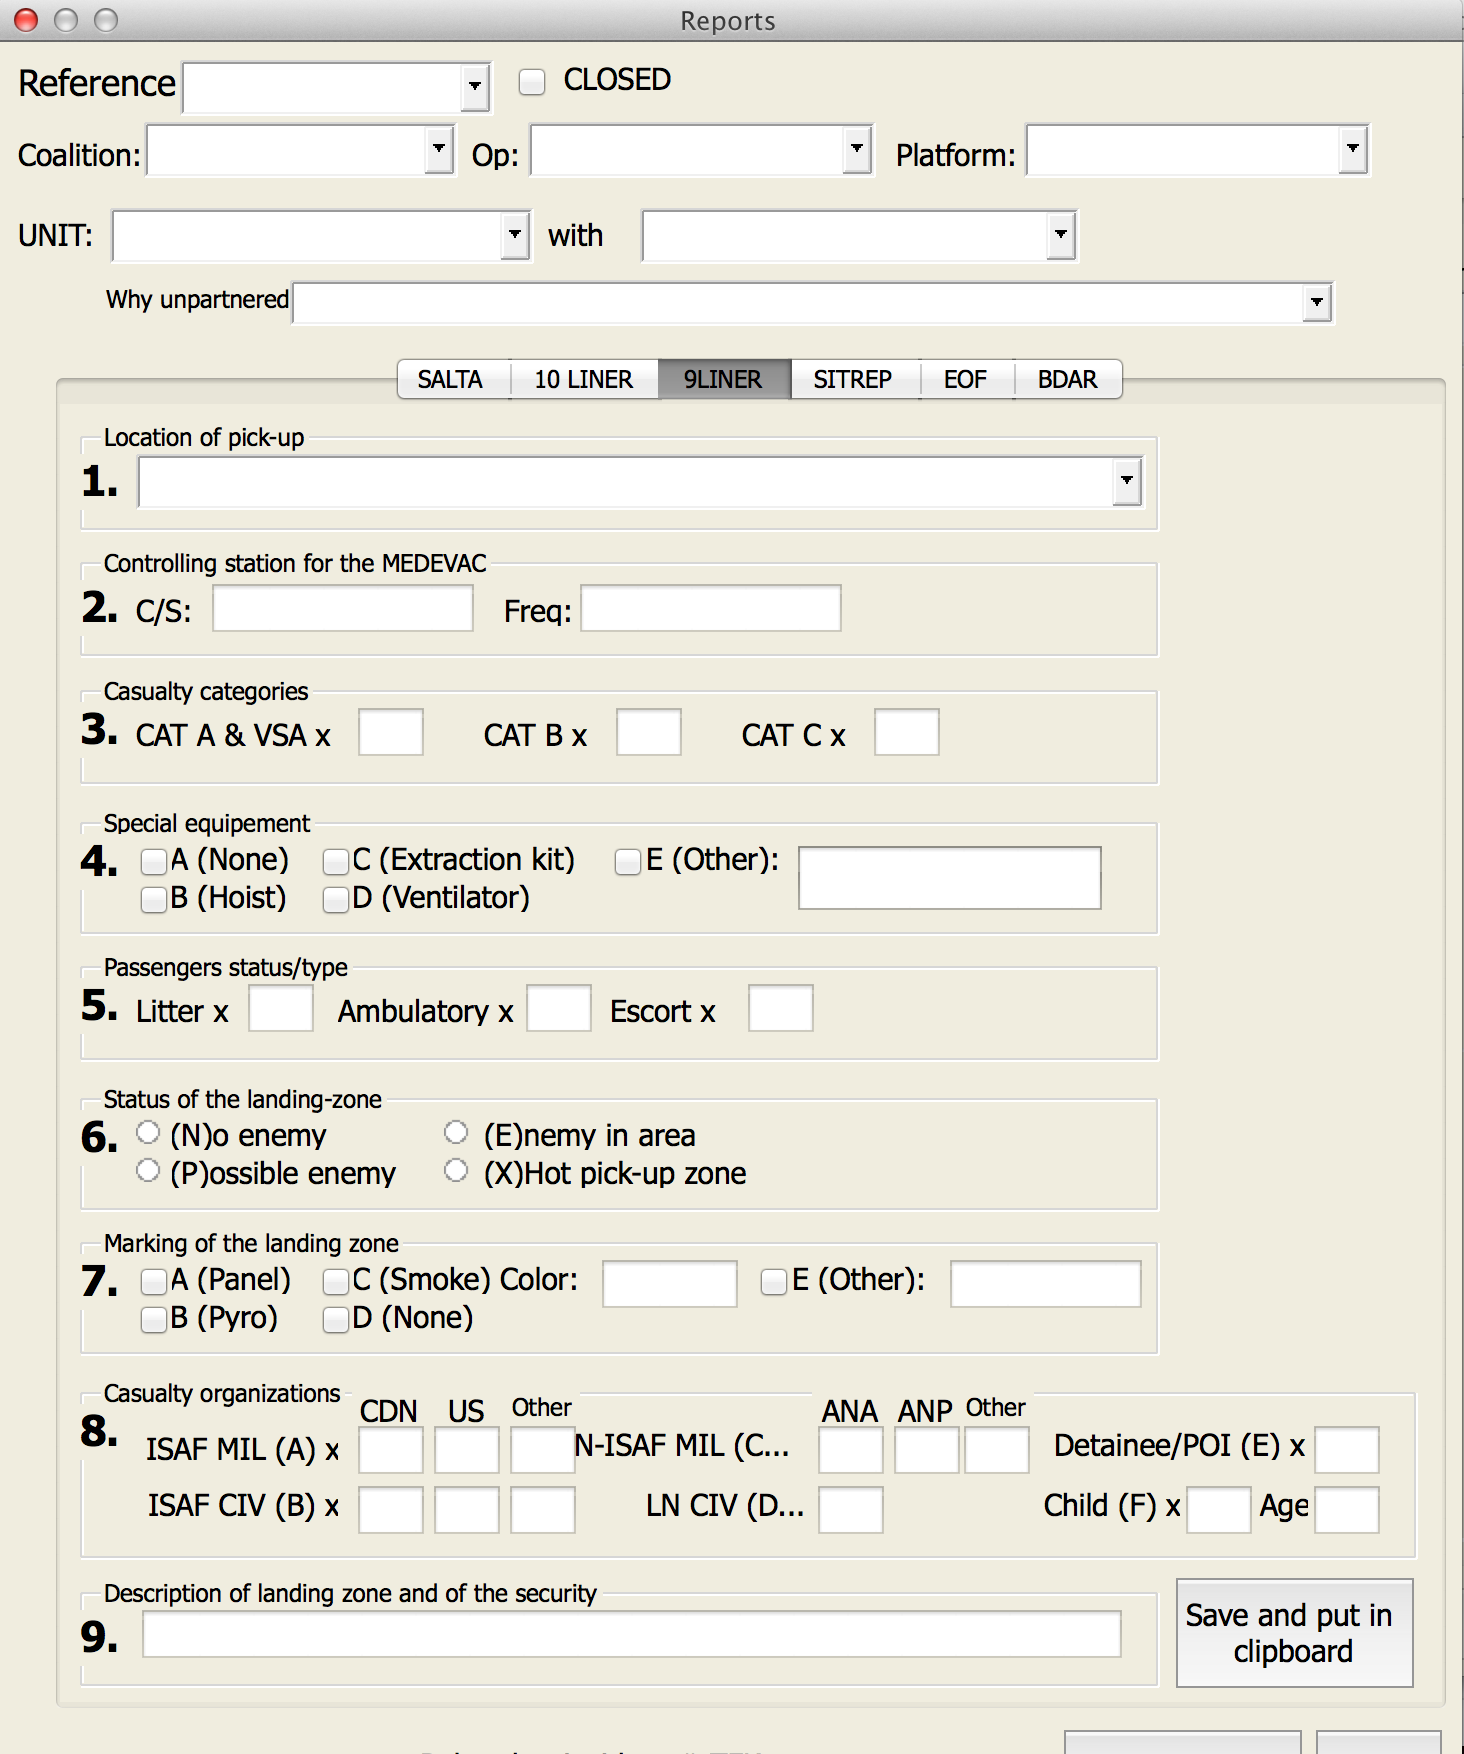
Delays responding to IED attacks were frustrating and lethal.  Antoine knew that automating the process with a computer program would speed this up but he had no idea where to start. “I googled a bit and came up with people saying that to program, you had to learn Java or C, and needed a compiler for them.” But those resources weren’t available to him.  Excel was.

A familiar story for Microsoft Office developers.  People on the “front line” know they need to solve a problem.  Pros tell them they need skills that are unavailable and tools that are unauthorized. What do clever humans do when they refuse to give up?  Use available materials.  Excel & VBA are an easy entry point for non-coders with an aptitude for problem-solving. Unfortunately, VBA is too often dismissed as inadequate or unserious.  Anything popular amongst the muggles must not be legit.  But for version 1.0 prototypes its often the perfect option.  No one else was going to develop that solution for Antoine.  He did it himself.  He understood the problem intimately and knew instinctively what a good result would look like.  Once proven, this application could be completely rewritten by a “pro” if there was a compelling reason.

When a power user develops a tool for their coworkers, he rarely thinks about branding. It doesn’t get a fancy codename like “Centurion Epicator Commforce III”. It’s called “Antoine’s J3 AVN helper” (see cell B1 above). Or “Jada’s Estimate tool” or “Nick’s Order tracker”.

Can you imagine a complete noob being able to get the same result with Java or C#?  First timers in Excel usually start with input/output right on the sheet.  Then move to validation, drop-downs, buttons, UserForms, add-ins, etc.  Start simple, build skills, harden the application.  Here’s a complex data entry form he designed:

Antoine humbly shares some of his “first lines of code” on GitHub warning us “it may hurt your feelings” because its got new-coder smells.  But that’s not a symptom of VBA, its because it was his first project and he was untrained.

Once he discovered the inherent power in Excel, Antoine built more solutions, got recognized by leadership and became a professional software developer in civilian world, graduating this year with a comp sci degree. He’s working for DigitalOcean now.

Kudos, Antoine.  Next time someone says Excel VBA is for sissies…I’m going to send them to you.

twittermail

Clouds on the horizon for Office developers: Stormy or fluffy?

For 20 years I’ve been making cool solutions in Microsoft Office: software that my clients already know & love.  Each component of the Office suite has its own specialty we can leverage.  With Visual Basic for Applications (VBA) I can turn Excel into a self-service BI platform.  Or Word into a police reporting system linked to an IBM AS/400 record-keeping RDBMS.  Or using Access to manage meals-on-wheels delivery schedules, dietary preferences, and billing.  Outlook’s messaging, contact management and task calendaring can be folded into a solution.  All these amazing tools work together and reduce the amount of coding I have to do as a programmer.  So much goodness is already baked in.

But things have been changing. And I’m worried we’re headed for a Cat5 “sheetstorm” when the IT Depts no longer sees Office as a development platform and users revert to labor-intensive, Excel wrangling so solve their data problems.  Microsoft has been sidling away from their own super-applications like a bored boyfriend. The old ways of Office are not sexy any more. VBA? No further improvements and virtually ignored by MS. VSTO? Meh. Power Query, Power Pivot, PowerBI are terrific new tools I’m already putting to use. But for automation, its less clear what the future holds. What will be the best practices and design patterns for professional departmental solutions? “Office Dev” at Microsoft now means Javascript & and Office UI Fabric and a bunch of stuff I truly do not fathom.


TV Dinner

Like the dark days of TV dinners and instant coffee. Modern! Cheap! Fast! Convenient! But did anyone really want that sad lump of salisbury steak or a cup of Sanka? Eventually we rediscovered the pleasures of freshly roasted coffee, heirloom veggies and “street food.”  Are we headed for a situation where widgets and web apps are all we get, or am I just being a change-averse curmudgeon?

I’m headed to the Data Insights Summit in Bellevue, WA on March 22-23 to get some answers.  There are lots of conferences for SQL Server DBAs and Visual Studio (.NET) developers.  But this is one is right up my alley.  Microsoft folks will be there.  So will experts on data analysis, business intelligense, dashboards, statistics, and all the other dark arts of Excel wizardry.  I’ll be taking notes and reporting what I learn here on this blog.


twittermail